


A World Bank Report: Climate Resilient Cities
This Primer is the outcome of a “Green Cities” Technical Assistance project ledby the World Bank’s East Asia and the Pacific Region Sustainable Development Department (EASSD), with collaboration and co-funding from the Global Facility for Disaster Reduction and Recovery (GFDRR) and the United Nations International Strategy for Disaster Reduction (UN/ ISDR). 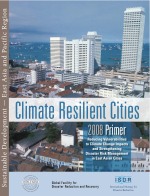
Climate Resilient Cities: A Primer on Reducing Vulnerabilities to Climate Change Impacts and Strengthening Disaster Risk Management in East Asian Cities is prepared as a guide for local governments in the East Asia Region to better understand the concepts and consequenc- es of climate change; how climate change consequences contribute to urban vulnerabilities; and what is being done by city governments in East Asia and around the world to actively engage in learning, capacity building, and capital investment programs for building sustainable, resilient communities. The Primer is applicable to a range of cities – from those starting to build awareness on climate change to those with climate change strategies and institutions already in place. An accompanying CD-ROM of City Profiles is included to assist cities to understand in more detail what other cities are doing today.
It is now undeniably evident that the global climate is changing as a result of human- induced greenhouse gas (GHG) emissions. Increased levels of heat trapped in the atmosphere have set off a process that is modifying weather patterns, which in turn affect temperatures, sea levels, and storm frequencies. This will impact cities and other urban areas, especially those in coastal zones. Asia already experiences the greatest number of flood events worldwide. Since the beginning of the 21st century, Asia has experienced more than 550 floods affecting over 850 million people.2 Out of China’s estimated urban population of 400 million, 130 million live in coastal cities that are vulnerable to sea-level rise.3 The high incidence of hydro-meteorological and other disasters affecting urban areas, particularly in vulnerable regions, is a challenge to local officials and their communities in being prepared and proactive in reducing their GHG emissions and in addressing increasingly frequent and extreme climate change events.
The world is at a unique moment in time. Three major movements are coming together: urbanization, decentralization and the rise of domestic capital markets. The way cities are managed to deal with their growth and the increase of their vulnerabilities is very important in this context.
This was written for The Asia / Pacific Region but is equally applicable to all coastal cities and Small Island Developing States (SIDS) Editor
![]()
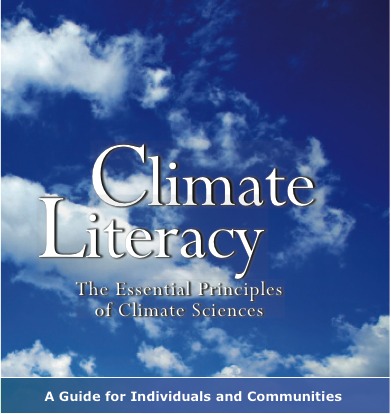
The Rough Guide to Climate Change
Glaciers calving like their‘s no tomorrow, sea ice dwindling to patches - it’s easy to find drama in the warming of our planets coldest waters But only a small part of the Earth’s oceans ever produce ice. What about the tropical and mid-latitude waters, the ones that together span more than half the planet? If appearances can deceive, then these oceans are master tricksters. They might not look much different to the naked eye than they did a century ago, but they have gone through quite a transformation - warming up and growing more acidic, among other things. It appears they’ve hidden the true impact of our energy choices quite skilfully, absorbing some of the heat and CO2 that would have otherwise warmed the atmosphere.
(From The Rough Guide to Climate Change by Robert Henson)
![]()
Findings of the IPCC Fourth Assessment Report – Implications for adaptation in small vulnearable communities. Microsoft PowerPoint document (large file) from the Caribbean Community Climate Change Centre
Many scientists have suspected as much for years but it was not until a team of NASA scientists let by Sydney Levitus assembled a variety of deep water measurements spanning the period from 1948 to 1998 that they discovered that the major oceans exhibited warming down at least 1000m (3000ft), and that the top 300m (1000ft) had warmed globally by about .03 degrees Celsius. This means that the total heat absorbed by the oceans represents approximately 10% of the energy trapped by human produced greenhouse gas emissions in the last fifty years. This causes the oceans to expand, which they have done by about one inch. Not a lot you may say, but to this you have to add the liquid that is being added by melting glaciers and ice caps.
![]()
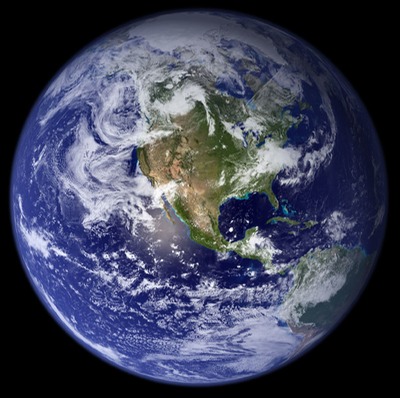
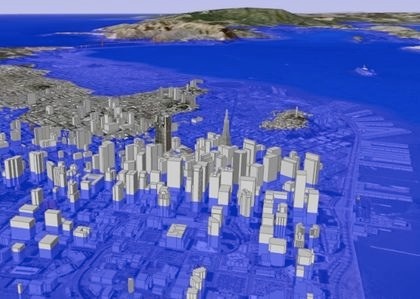
The Great Debate: How Fast Will Sea Levels Rise?
~ Ted Scambos, lead scientist at the National Snow and Ice Data Center at the University of Colorado, Boulder.
A team of scientists are now hard at work in a race against the clock at a remote outpost in northern Greenland. They are attempting to answer one of the most critical questions of global warming: how fast will sea levels rise? It’s a question the experts are eager to find answer for, as the rate at which some glaciers are melting away into the ocean has already doubled, far outpacing former estimates.
![]()
Arctic Sea Ice Bottoms Out For 2007, Shatters All Time Record Low, Say CU-Boulder Scientists
Sept. 20, 2007 The minimum low Arctic sea ice extent for 2007 is about 460,000 square miles less than the previous minimum record, set in 2005. The area of lost sea ice is roughly the equivalent of the area of Texas and California combined. Scientists from the University of Colorado at Boulder's National Snow and Ice Data Center said today that the extent of Arctic sea ice appears to have reached its minimum for 2007 on Sept. 16, shattering all previous lows since satellite record-keeping began nearly 30 years ago.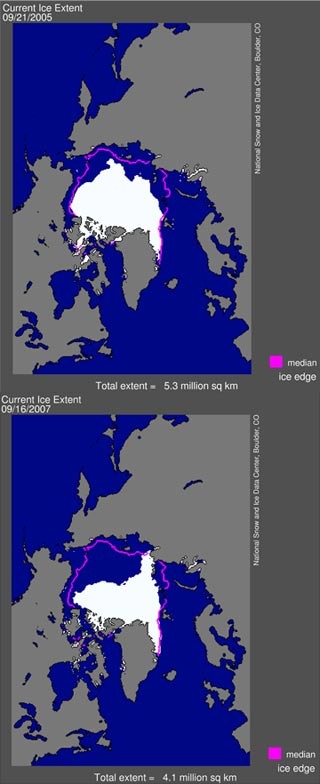
The Arctic sea ice extent on Sept. 16 stood at 1.59 million square miles, or 4.13 million square kilometers, as calculated using a five-day running average, according to the team. Compared to the long-term minimum average from 1979 to 2000, the new minimum extent was lower by about 1 million square miles -- an area about the size of Alaska and Texas combined, or 10 United Kingdoms, they reported. The minimum also breaks the previous minimum set on Sept. 20 and Sept. 21 of 2005 by about 460,000 square miles, an area roughly the size of Texas and California combined, or five United Kingdoms, they found. The sea ice extent is the total area of all Arctic regions where ice covers at least 15 percent of the ocean surface. (Obviously the Arctic ice which is sea ice, i.e. floating is not going to contribute to a rise in sea level. Ed)
Greenland's Ice Cap is Melting at a Frighteningly Fast Rate
Published on Friday, August 11, 2006 by the San Francisco Chronicle
The vast ice cap that covers Greenland nearly three miles thick is melting faster than ever before on record, and the pace is speeding year by year, according to global climate watchers gathering data from twin satellites that probe the effects of warming on the huge northern island
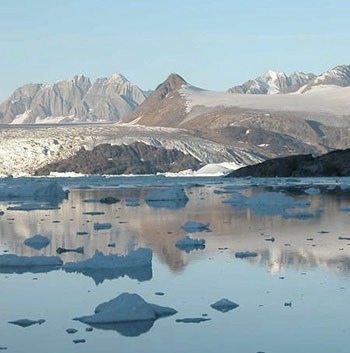
(Chunks of ice regularly fall into the sea in Greenland, where ice is melting at a rate three times faster than it was only five years ago. (Science photo by J.A. Dowdeswell))
The consequence is already evident in a small but ominous rise in sea levels around the world, a pace that is also accelerating, the scientists say. According to the scientists' data, Greenland's ice is melting at a rate three times faster than it was only five years ago. The estimate of the melting trend that has been observed for nearly a decade comes from a University of Texas team monitoring a satellite mission that measures changes in the Earth's gravity over the entire Greenland ice cap as the ice melts and the water flows down into the Arctic ocean. "We have only been watching the ice cap melt during a relatively short period," physicist Jianli Chen said Thursday, "but we are seeing the strongest evidence of it yet, and in the near future the pace of melting will accelerate even more."
The same satellites tracking Greenland's ice cap also are monitoring the melt rate of Antarctica's ice cover, and there too the melting is adding to the global rise in sea level, according to another team of scientists. Next to Antarctica, Greenland, a self-governing Danish territory, is the largest reservoir of fresh water on Earth and holds about 10 percent of the world's supply. The increasing flow of fresh water -- most of it from glaciers melting on Greenland's eastern coast -- is already beginning to change the composition of the ocean's salt water currents flowing past Northwestern Europe, the scientists say.